Forecasts are distributions, points are decisions.
Flood Me Once, Shame on You
Grand Forks, North Dakota, faces the possibility of flooding so much that it has flood outlooks from the US National Weather Service.
In 1997, the city faced a potentially large flood. The protective levees were 51 feet tall (15.5 meters), and the flood was forecasted to reach 49 feet. When a forecast, estimate, or prediction is reported as a single number, it is called a point estimate. Point estimates are convenient because they are a single number to calculate, display, and communicate. They keep our perception of reality neat and tidy. But behind every point estimate is a distribution.
Distributions, Nice to Meet You
A distribution is all possible values of something and how often they occur. It can be a distribution of observed data, such as an empirical distribution, like a gelato shop's flavors menu and how much each flavor was sold that year. Distributions can also be of probabilities, like the forecasted distribution of unemployment claims next month.
Distributions have characteristics. We usually focus on their center and spread. (Other measures include skew, which measures symmetry, or kurtosis, which describes the distribution's peak shape.) Plotting your data is a best practice because it quickly reveals distribution characteristics you'll want to calculate and track.
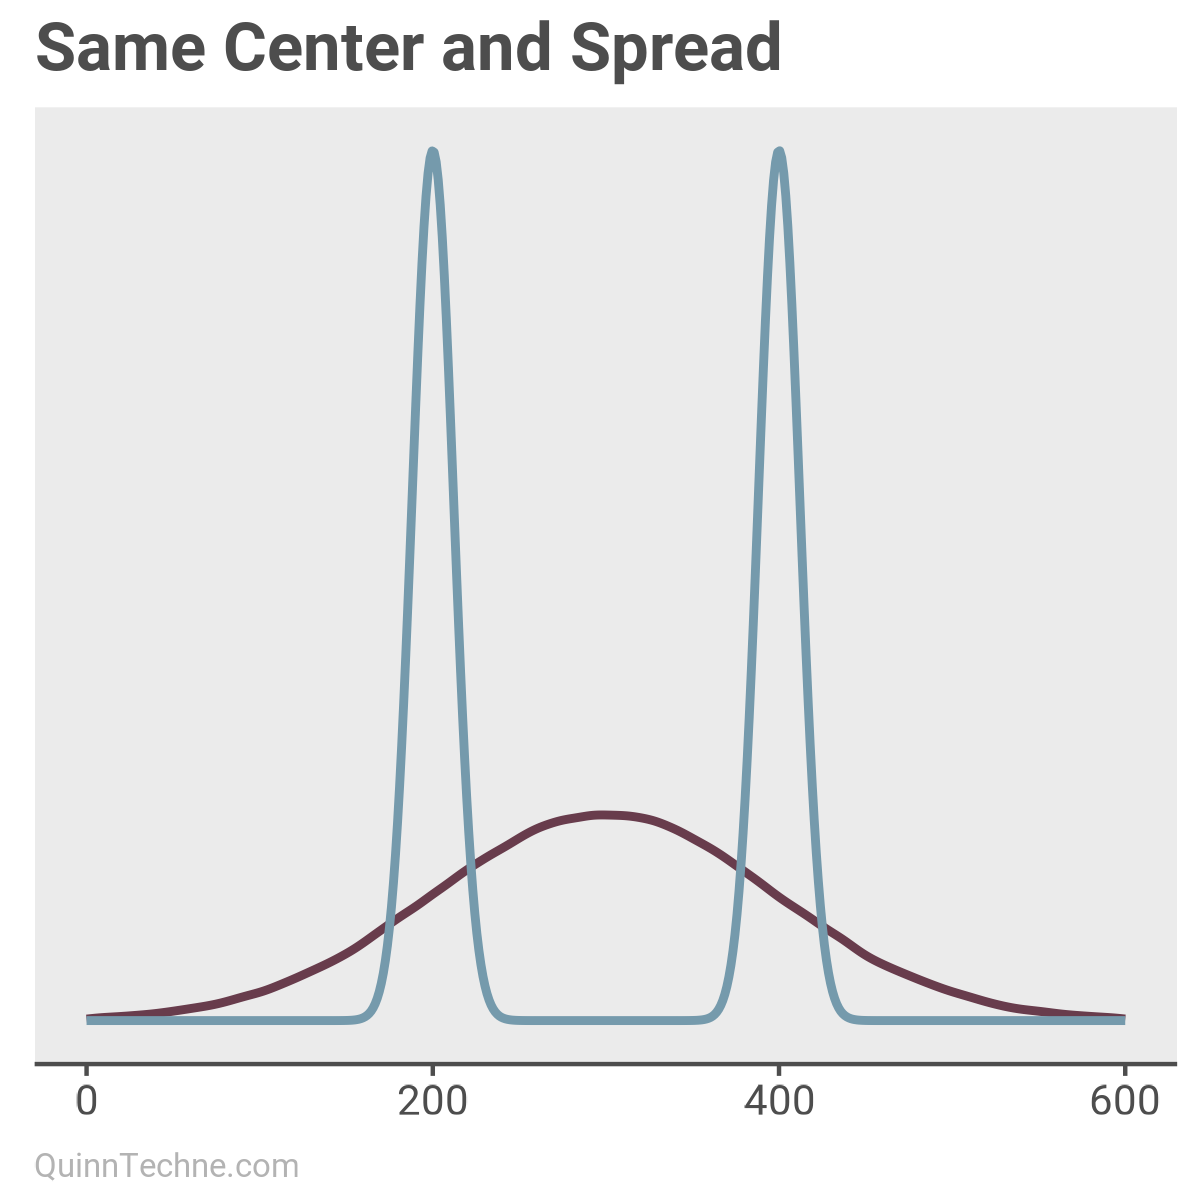
For example, these two distributions share the same center and spread! Yet, we hear "on average" or "expected to be," which implies statistics like the mean—the center. However, those phrases also evoke ideas of what is most likely to happen. That may be true if the distribution is symmetrical with a single peak (like the purple distribution). But we can only sometimes assume symmetry. So, we must plot our data.
Consequences of Forgetting Distributions
The advantage of thinking in distributions is that you keep in front of you the uncertainty—the risk—of what you're dealing with.
Returning to Grand Forks, the flood did come. The forecast was 49 feet, the levees 51 feet, and the flood was 54 feet. Ouch. The forecasters knew the forecast distribution was 49±9 feet but had been "... afraid the public might lose confidence in the forecast if they had conveyed any uncertainty in the outlook."
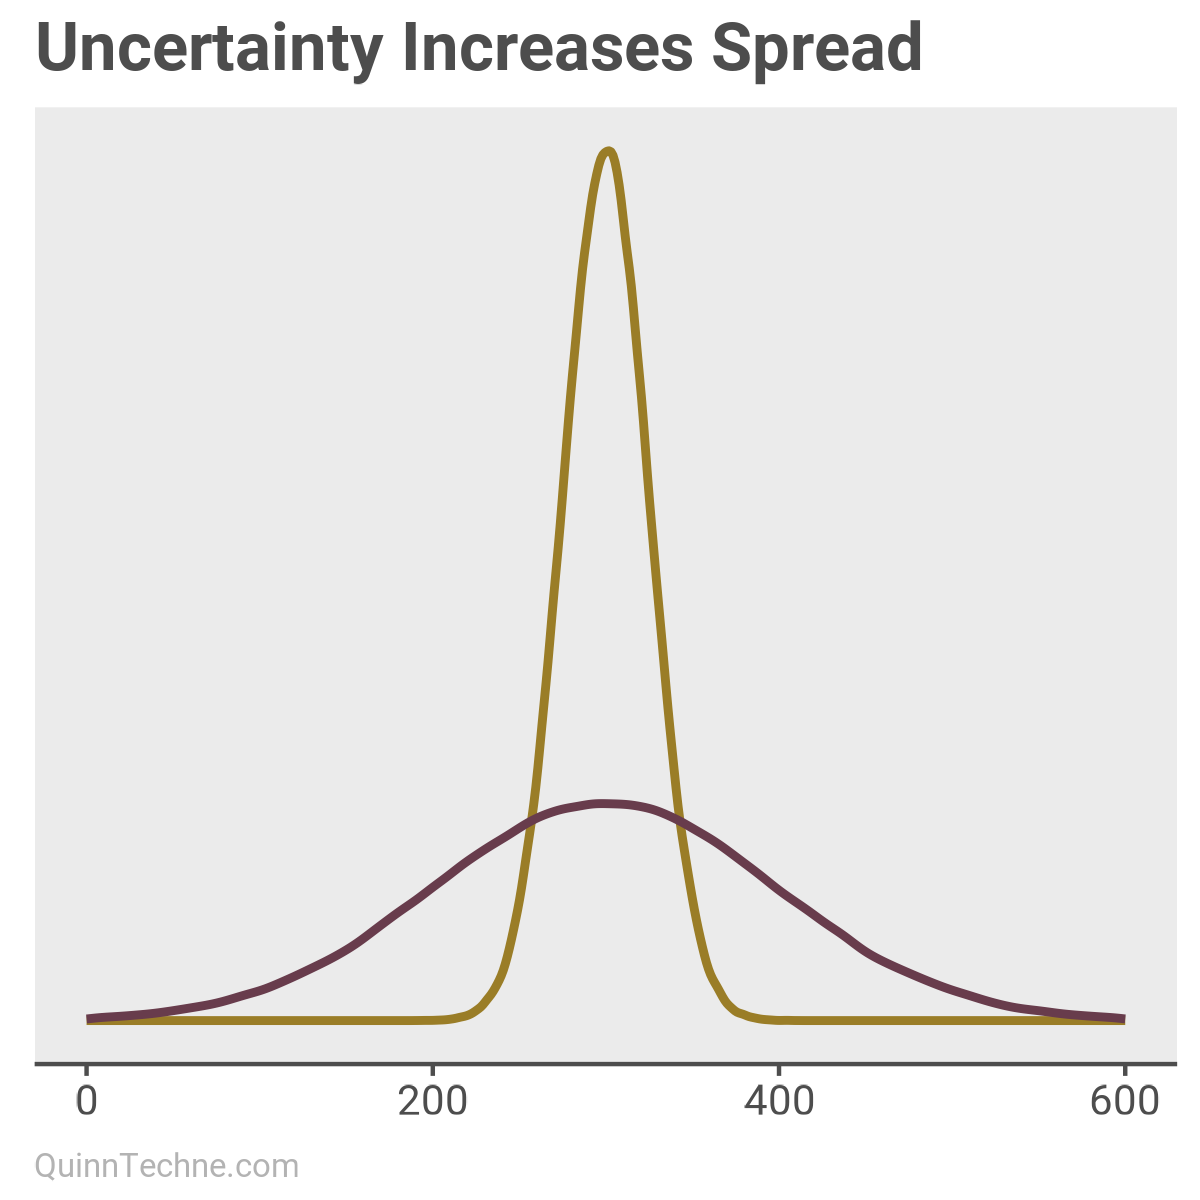
The spread of a distribution is a function of uncertainty (the ±9 in our flood example). The more uncertain, the more spread and flatter the distribution becomes because more possible values might realistically occur (the purple distribution). We just don't know, which makes moving forward under uncertainty difficult.
Decision Theory and Managing Risk
However, armed with distributions, you can make decisions under uncertainty. One way to view decision-making is as Decision → Outcome → Utility.
First, list your possible decisions. Next, using your distributions, look at all possible outcomes given that decision and how often they occur. For each outcome, assign a utility score. Last, make the decision that maximizes your utility.
For example, suppose the decisions facing Grand Forks in 1997 were to bolster the levees' height by some height of sandbags. First, you could calculate each decision's outcome: the probability and associated damage of the flood cresting over the levees. Last, you map utility to each outcome. In this case, the utility calculation might be flood damaged in dollars versus the cost of time, labor, and supplies to bolster the levees. Here is an example with mock data.
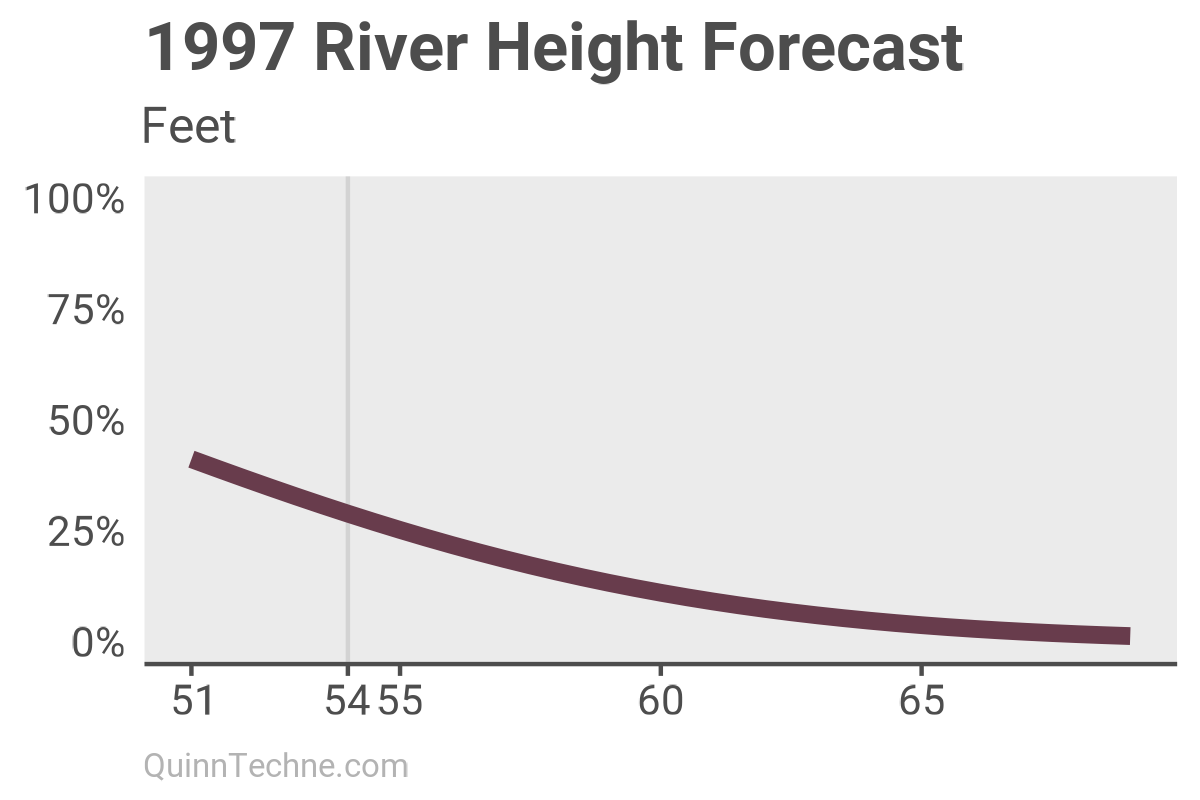
This plot shows the forecast of the river reaching different heights during the flood peak. Remember, the levees were 51 feet tall. The line marks the flood height that happened.
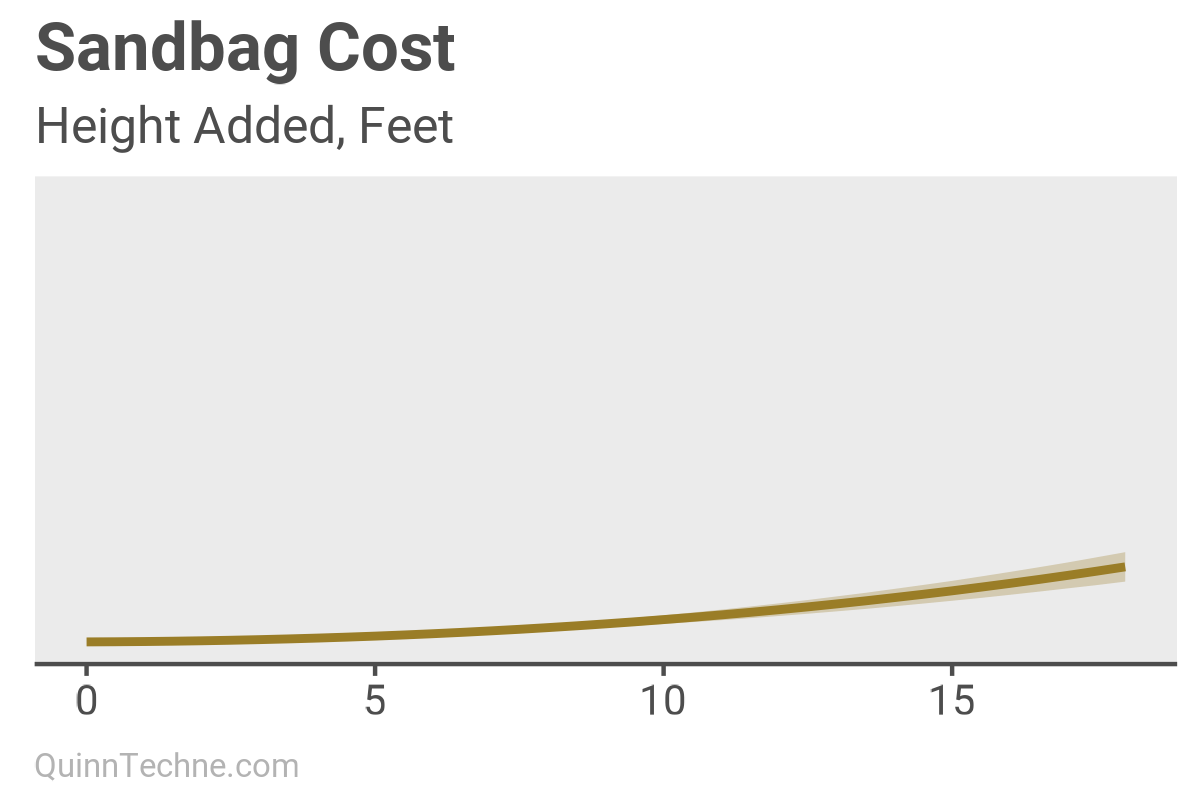
The above plot shows the potential cost of adding sandbags to increase the levee height.
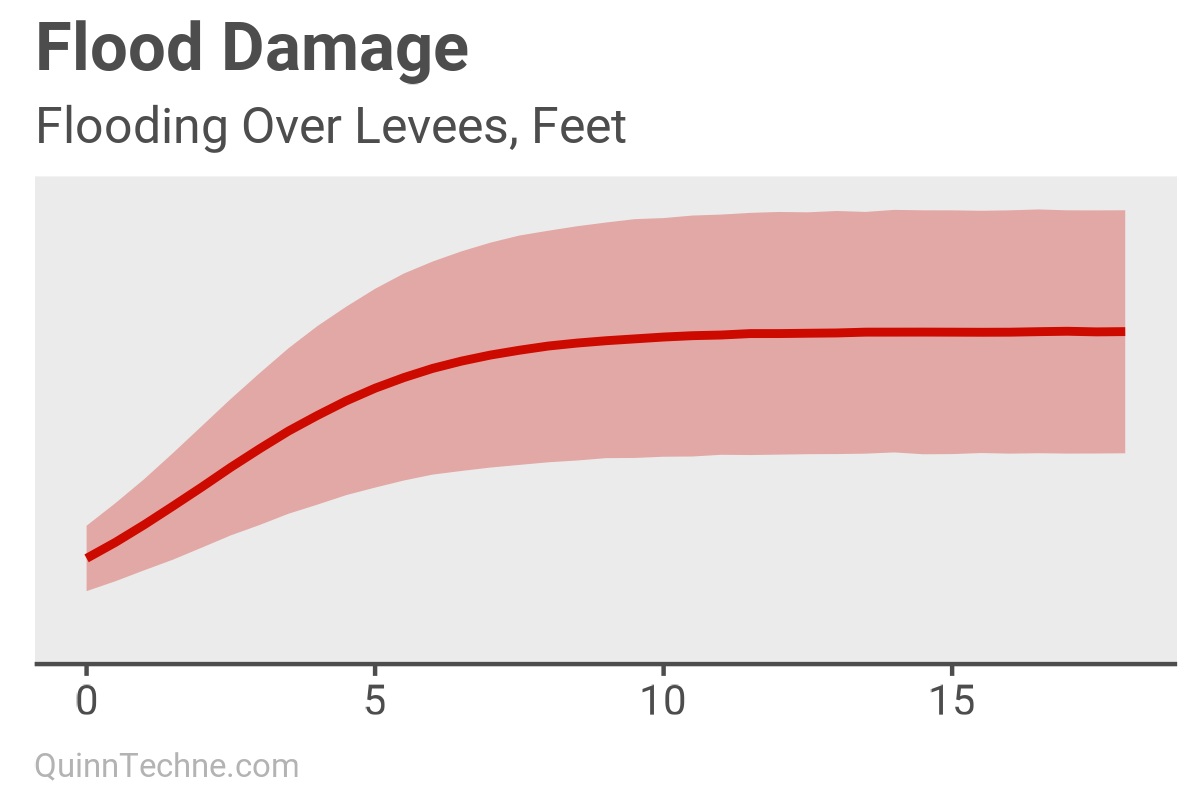
Next, we look at the potential flood damage for every foot the river exceeds the levees. This information can be seen as an outcome of flooding over a given levee height, with or without bolstering the height with sandbags.
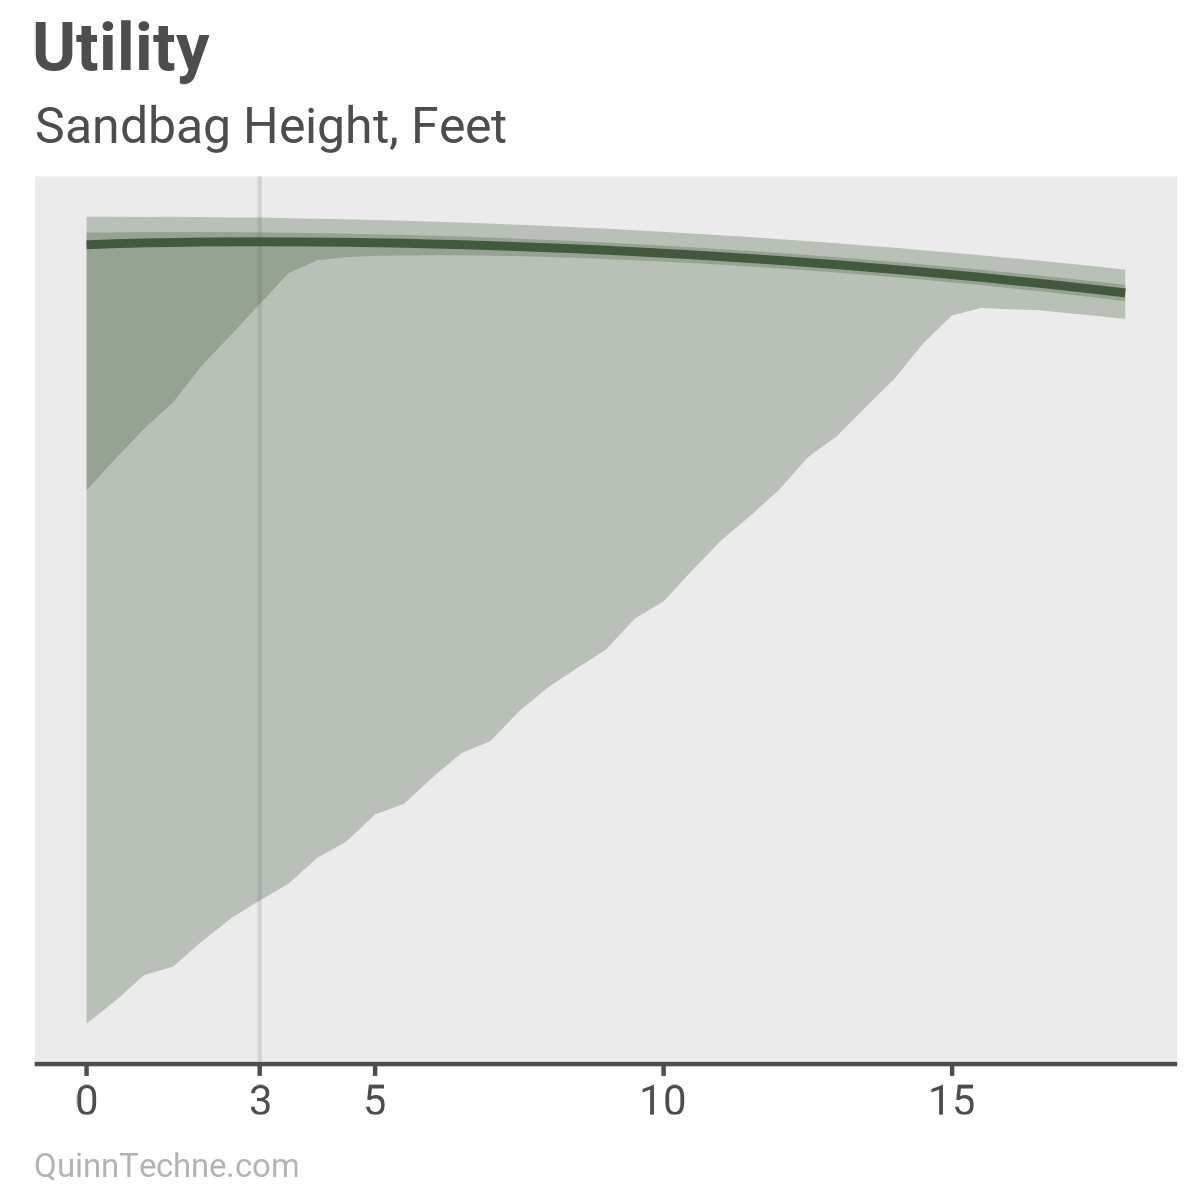
Combining the tradeoffs of flood damage or sandbag costs, we get this utility chart. Our goal is to maximize utility, which is marked with a gray line at the decision to build a three-foot wall of sandbags for a total 54-foot barrier against the river.
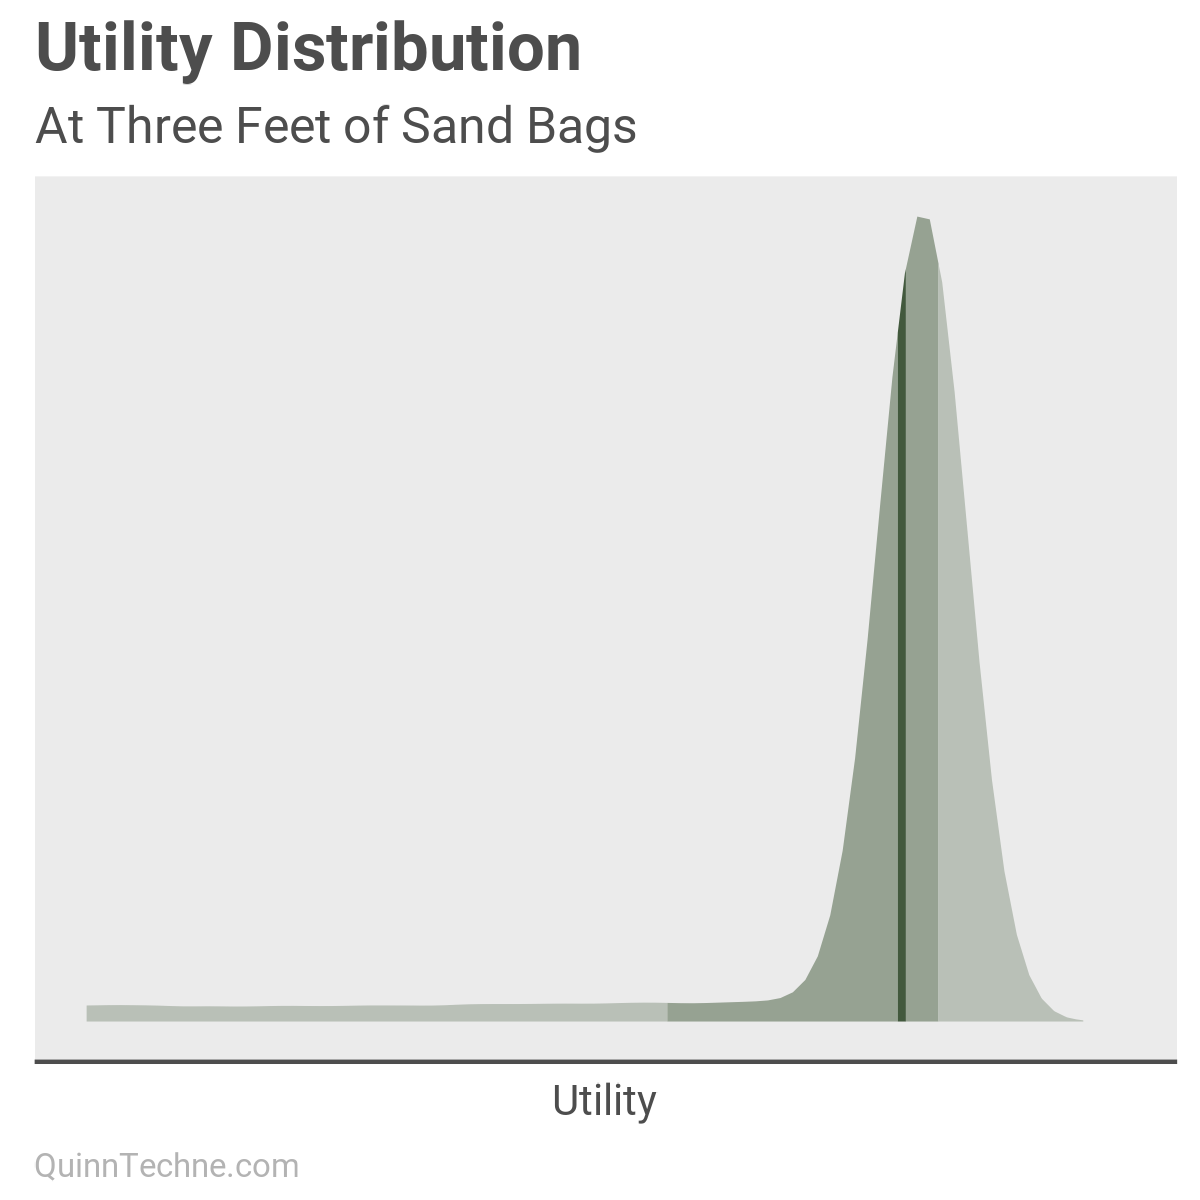
This distribution is at the cross-section at the gray line of the prior utility chart at the three-feet mark.
Think in Distributions
On a happy note, the flood forecasts now include distributions. As the Grand Forks flood illustrated, relying solely on single-point estimates can be dangerous. To quote the scientist and statistician Richard McElreath, "Estimates are distributions, points are decisions." Thinking in distributions allows you to parse noise and uncertainty, focus on the signal, and make more nuanced decisions by mapping outcomes and utility as distributions.
Gelman, A., Carlin, J. B., Stern, H. S., Dunson, D. B., Vehtari, A., & Rubin, D. B. (2013). Bayesian Data Analysis (3rd edition). Chapman and Hall/CRC.
McElreath, R. (2023). Statistical Rethinking 2023 - 07 - Fitting Over & Under. YouTube. https://www.youtube.com/watch?v=1VgYIsANQck
Silver, N. (2015). The Signal and the Noise: Why So Many Predictions Fail—but Some Don't. Penguin Books.
Wikipedia. 1997 Red River Flood. Accessed March 2024, from https://en.wikipedia.org/wiki/1997_Red_River_flood
This website reflects the author's personal exploration of ideas and methods. The views expressed are solely their own and may not represent the policies or practices of any affiliated organizations, employers, or clients. Different perspectives, goals, or constraints within teams or organizations can lead to varying appropriate methods. The information provided is for general informational purposes only and should not be construed as legal, actuarial, or professional advice.


