Beware of the single number estimate.
Scientist and statistician Richard McElreath asserts, "Estimates are distributions; decisions are points." Echoing this sentiment, consider the case of Daniela Poggiali, a nurse accused of murdering her patients.
Poggiali worked at a hospital that specialized in caring for terminally ill and elderly patients. In 2014, she was accused of killing Rosa Calderoni with a lethal dose of potassium chloride. The prosecution built its case around multiple arguments, including that some potassium chloride had gone missing, alleging Poggiali had used it to administer a fatal dose to Calderoni.
When someone dies, potassium ion (K+) levels rise in parts of the body, making K+ associated with time since death or post-mortem interval (PMI). The prosecution brought in expert witnesses to compare Calderoni's K+ levels to what an average K+ would be for the same PMI, measured in hours since death.
In a 2022 paper, statisticians from Poggiali's defense team demonstrate their challenge to these findings. They used similar K+ data and the same model structure.

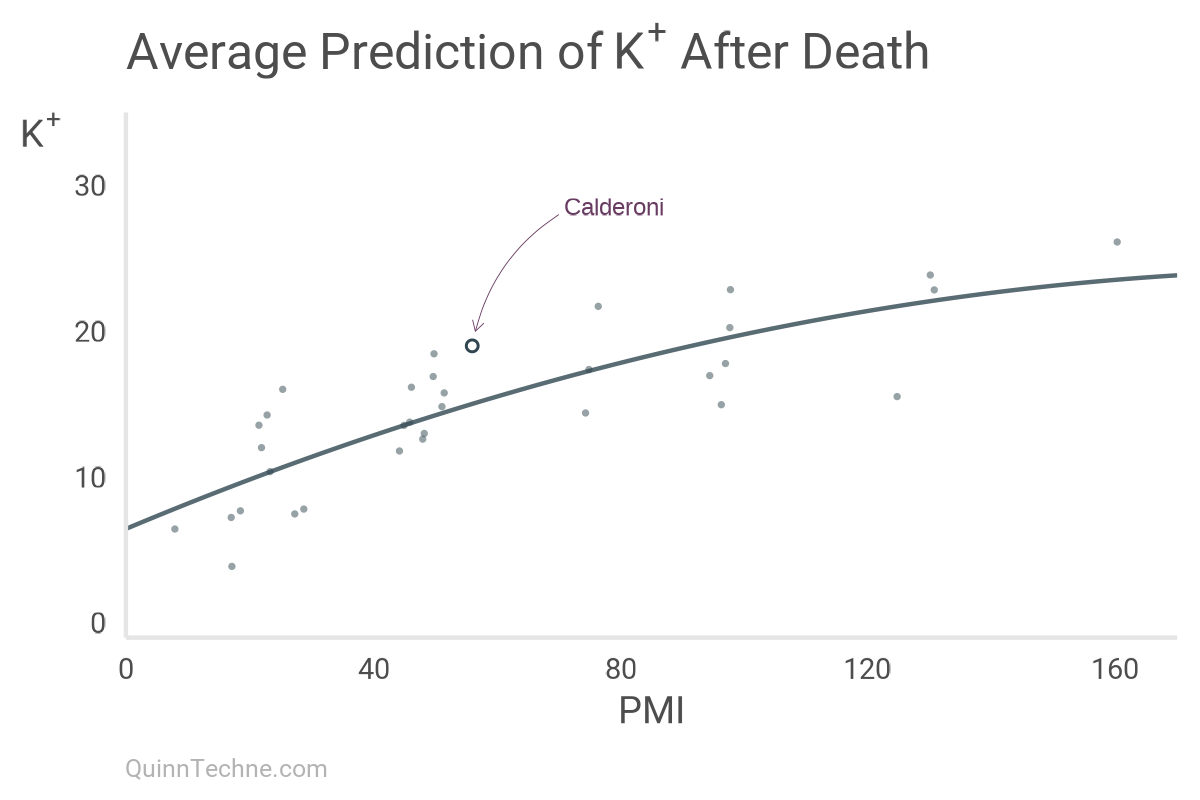
Calderoni had a measured level of 19 mM at 56 hours, higher than this model's predicted value, the thick line, by 25%. This type of finding in 2016 led to the assumption that the elevated K+ was the result of a deliberate lethal injection.
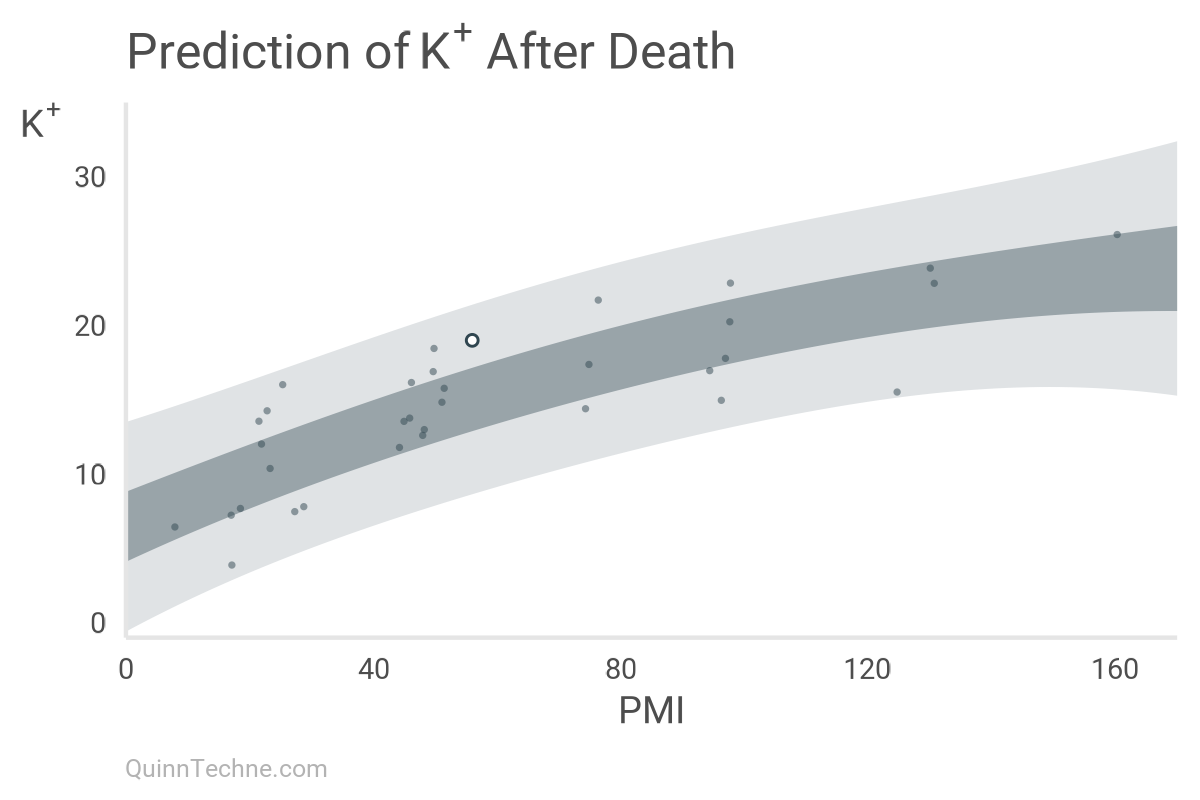
However, the defense statisticians introduced what the prosecution had overlooked: prediction intervals. These intervals, or distributions, provide a range around the predicted average value, illustrating where observations are likely to occur—not just indicating the average as shown by the single line in the previous chart.

These are my reproductions of the 2022 chart. The first one only shows the average, the one line. The second chart includes 50% and 95% prediction intervals with shaded areas. In this later context, Calderoni's K+ level falls within the expected range of variability for post-mortem cases, making it a plausible value rather than a suspicious outlier. In 2016, Poggiali was convicted of murder but won her appeal and was acquitted in 2017 of Calderoni's murder.
In the same 2022 paper, the defense statisticians wrote, "Using a point prediction based on a linear regression that does not account for variability is extremely dangerous." (think of the first chart). With that advice, consider your audience and how communicating intervals can enhance their decision-making, and perhaps a future Poggiali will be spared the interval between wrongful conviction and acquittal.
Dotto, F., Gill, R. D., & Mortera, J. (2022). Statistical Analyses in the Case of an Italian Nurse Accused of Murdering Patients. arXiv. https://arxiv.org/pdf/2202.08895
McElreath, R. (2023). Statistical Rethinking 2023 - 07 - Fitting Over & Under. YouTube. https://www.youtube.com/watch?v=1VgYIsANQck
Calculations and graphics done in R version 4.3.3, with these packages:
Qiu Y (2024). showtext: Using Fonts More Easily in R Graphs. R package version 0.9-7. https://CRAN.R-project.org/package=showtext
Wickham H, et al. (2019). Welcome to the tidyverse. Journal of Open Source Software, 4 (43), 1686. https://doi.org/10.21105/joss.01686
This website reflects the author's personal exploration of ideas and methods. The views expressed are solely their own and may not represent the policies or practices of any affiliated organizations, employers, or clients. Different perspectives, goals, or constraints within teams or organizations can lead to varying appropriate methods. The information provided is for general informational purposes only and should not be construed as legal, actuarial, or professional advice.

