Data is not enough. Draw your assumptions too.
My introduction to directed acyclic graphs (DAGs) was from the world of causal inference statistics. However, today, I will focus on using them as a tool for documentation and organizing your thinking.
A DAG shows how variables in your data are related. It has nodes with one-directional arrows between them to represent relationships. The main rule is that your arrows cannot make a loop between your nodes. Aside from that, if a node has an arrow coming into it, it is a child of the prior node and listens to its parent node: A change in the parent node affects the child node.
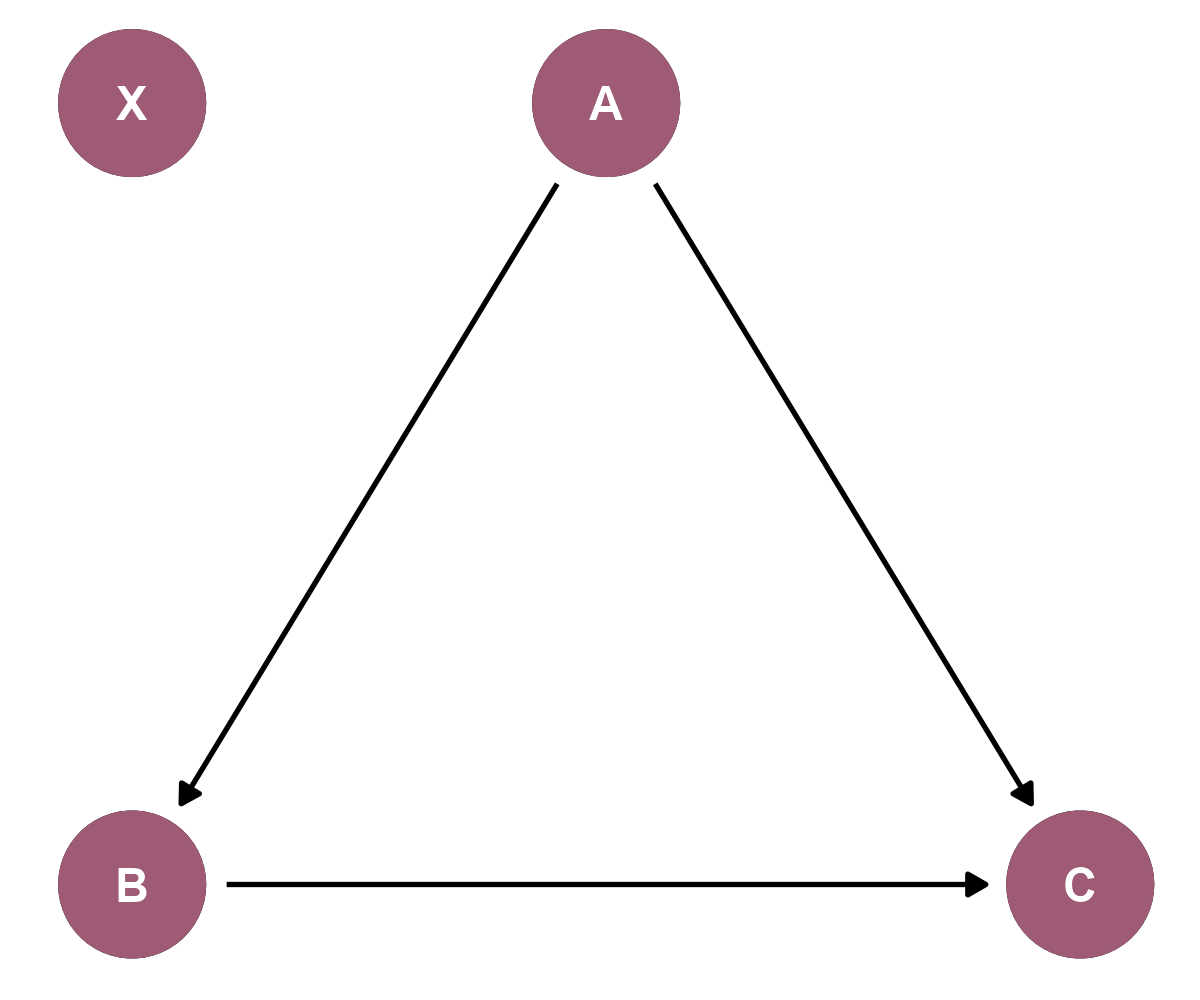
In this example DAG, variable A is a common relationship between B and C aside from the relationship C shares with B already. Variable X was considered but assumed to have no relationship to the other variables. For example, C might measure a kid's educational outcome where B is the influence of a kid's guardian, but B and C share A: the influence of, say, a grandparent. Variable X is the child's proficiency in Pig Latin... Typically, variable X is excluded from the graph when presenting it. Internally, though, variable X's presence is valuable because it is easier to recall and examine something present versus absent. More on this later.
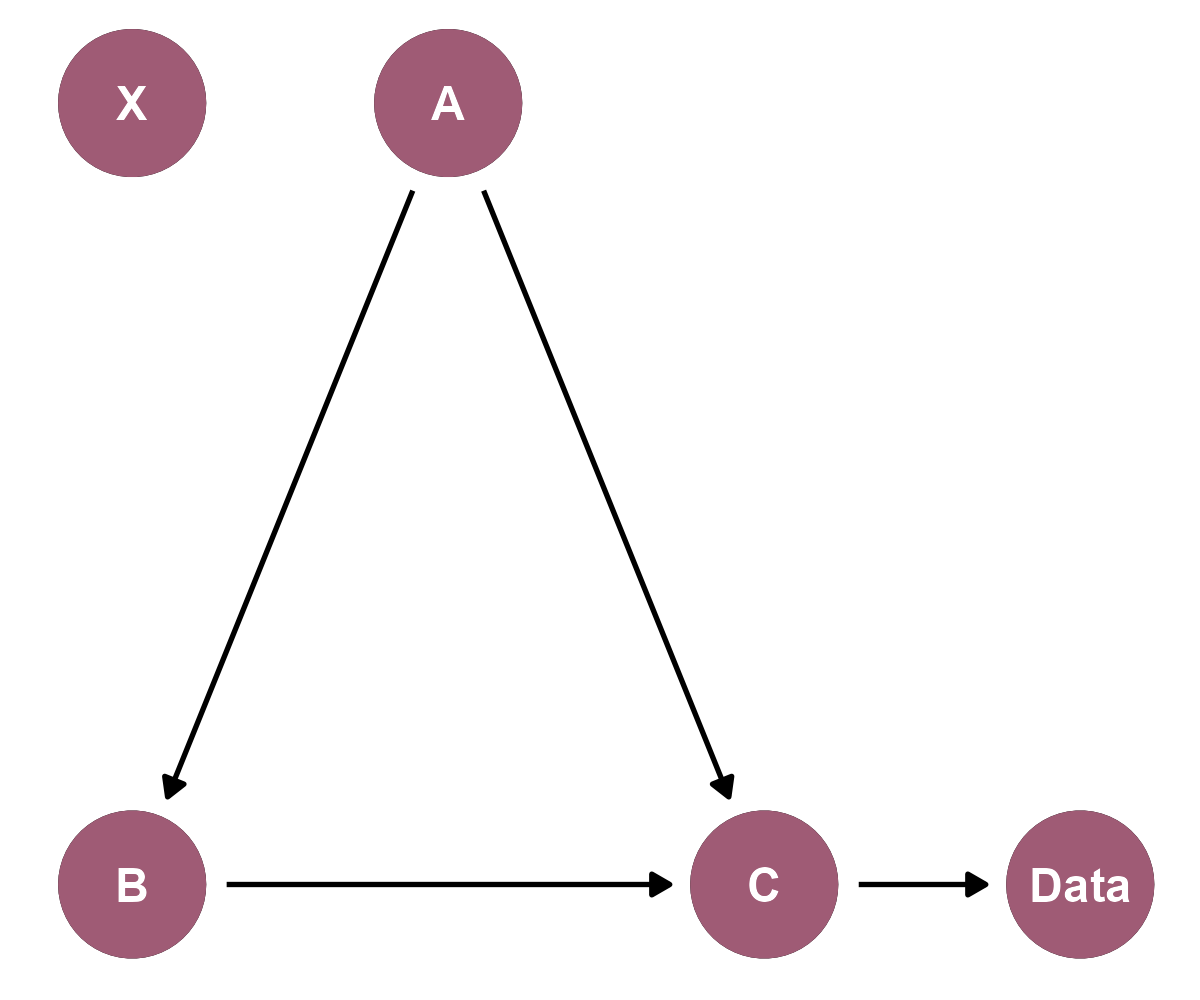
This next DAG is like the first example, but you may not observe C directly. Instead, you have data about C, and a lot can happen in that arrow between the conceptual C and the C presented by your data. For example, we could view a kid's educational outcomes through the data of tests: admission exams, IQ scores, professional accreditations. However, measurement error creates noise between variable C and the data about C: poorly worded questions, ambiguous grading rubrics, and so forth. Thinking about what data you have and what that data is trying to measure can give you insights about model limitations or prompt ideas about additional data you might need.
If you're bound by Actuarial Standards of Practice (ASOPs), DAGs will be handy. ASOP No. 23, Data Quality, says data should be selected considering external information and sampling methods if used. The DAG makes external variables explicit and measurement error is a cousin to sampling bias. Then, per ASOP No. 56, Modeling, the actuary should consider if the model appropriately recognizes dependencies. DAGs excel at displaying dependencies between variables because of the arrows connecting nodes.
So, Why Else DAGs?
By mapping variables and their relationships, you're being explicit about the variables and their causal interactions that may have generated the data. This type of generative thinking is valuable because it leads to insights about variables influencing, colliding, biasing, confounding, or mediating your model results.
Earlier, I mentioned leaving variable X in the DAG despite having no relationships. DAGs externalize your consideration; you can subject them to critique. Humans are poorly equipped to recognize when they might be wrong, but at the same time, we are fantastic at recognizing it in others. Be proud of your DAG, but also understand it could be improved despite your goal of being accurate. Show it. Let others check the considerations. If they like it, great; if not, then you have new information to consider, which may refute or refine your DAG.
Later, your DAG can serve as documentation. Memories of model details are evanescent (no, not the band). Work as if you have two-week rolling amnesia. "Did I consider X?" Why yes, I did—as you jab your finger into the DAG—it's right here!
Building DAGs
Excel example, R example? No. Instead, we will use one tool. And that's DAGitty. A fantastic tool for designing DAGs. It has many features for causal inference, but we will ignore those for now and simply graph nodes and their relationships.
Here's an example problem. Insurance companies hold receivables and we're interested in modeling how well they collect on these receivables because we care about mitigating financial distress. Some ideas and questions come to mind: Are different receivables more or less risky, how fast can receivables be collected, does staffing affect collection rates, has the company done well collecting before, how well is the company reporting receivables and associated collections?
First, we plot some nodes:
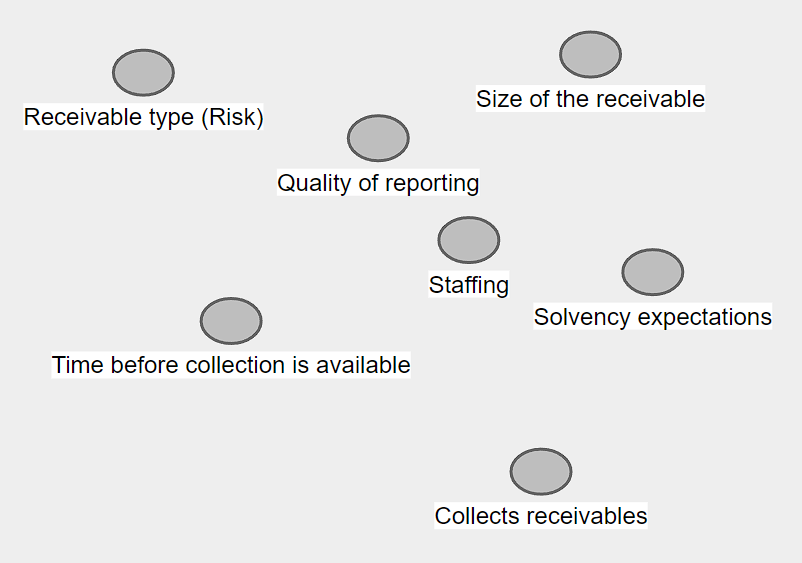
Then, we start making relationships:
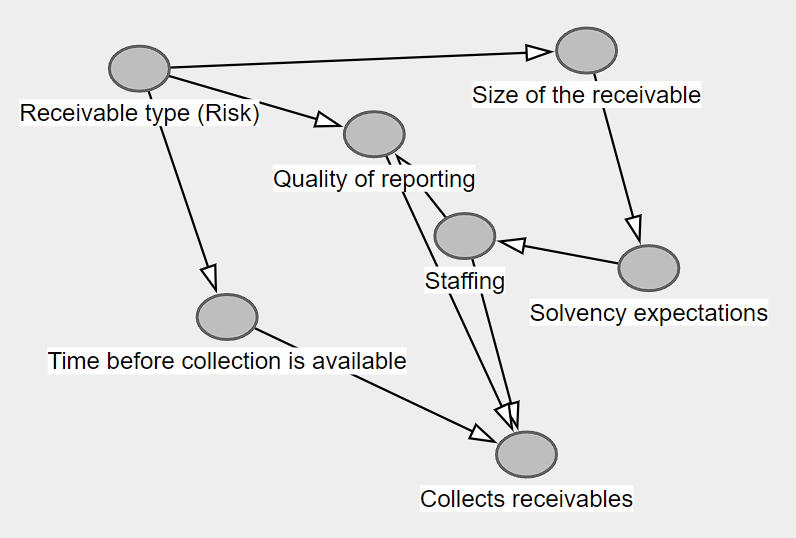
Now, we organize from left to right, top to bottom, to recognize that time is a causal force that imparts structure to data:
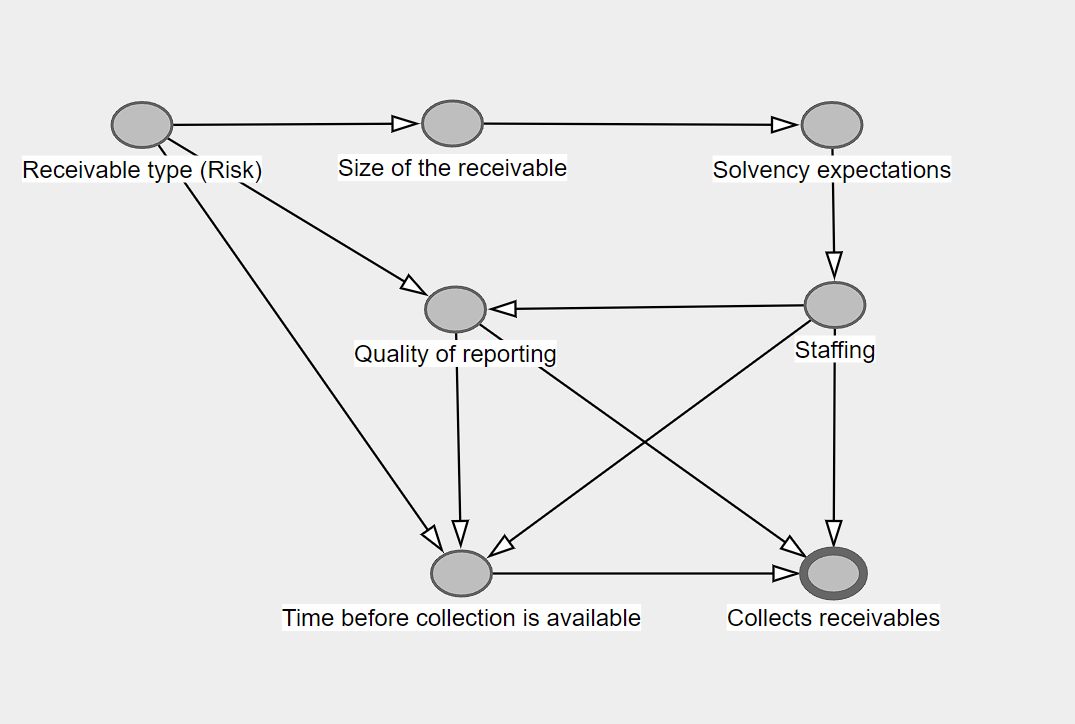
Remember, DAGs cannot have loops, so what do you do about nodes that seem to all interact? Instead of loops, you have spirals. I like to think of lags as a parent node in a spiral. Also, if you have several nodes clustered together, you can combine them into a super node for simplicity:
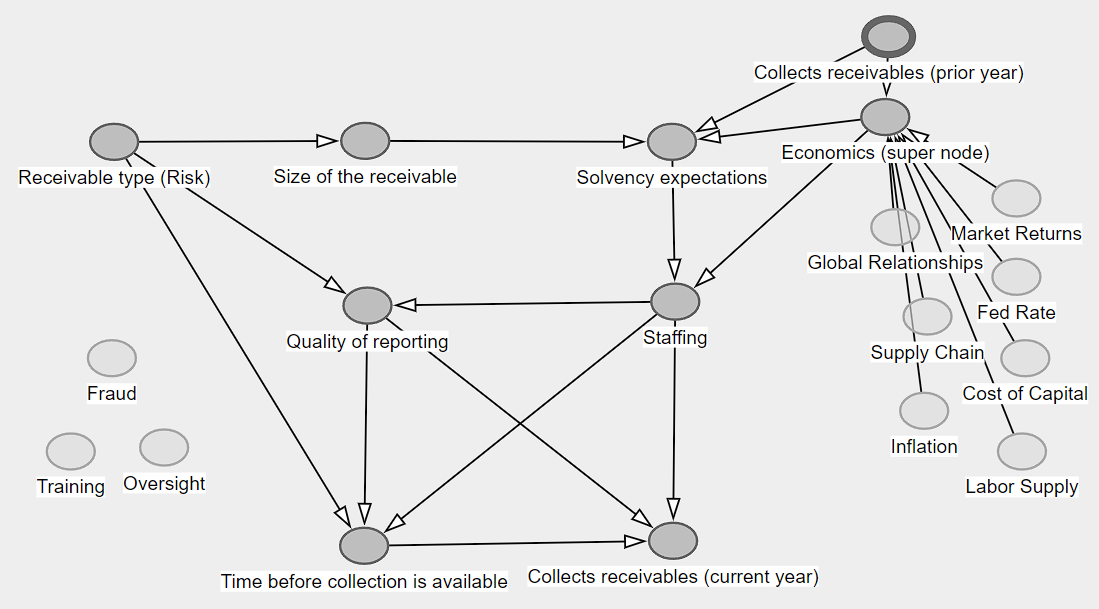
In this example, on the left, I've included some considered-but-no-relationship variables. It's debatable if they do or don't relate, but that's the point—externalized, discovered, critiqued—the DAG is working! The top right has collected receivables but from a prior period. You can think of feedback loops as feedback spirals. Lastly, there's an example "Economics" super node near the top right.
Sometimes, I will create a DAG at the start of the project, but I need to catch up on it later when the model is fleshed out. It's okay to reconcile what you started with to how the model ended up combining variables. After this update, ensure the nodes and relationships are still reasonable. New combinations can give you a nuanced understanding of the data or alert you to other model variables to incorporate. For example, maybe my model has a step that filters out companies with no established receivables. A node to add might be "Has receivables," and I make it a parent note with an arrow pointing to the node "Receivable type (Risk)." This positioning represents how all the downstream variables, down to my research question, are influenced by this new node.
Designing is iterative. So, you'll find yourself flipping between modifying nodes, relationships, and organizing. That's normal. Keep going until you feel ready to share your DAG.
Just the Start
I've been mentioning DAGs and causality. Data holds great sources of associations but no causes. You need an expert for that. Plus, a tool to link their knowledge to the data, which was my introduction to DAGs for statistical causal inference.
But for now, you can use DAGs as glorified documentation for clearer thinking. Data can offer more insights when you move beyond associations by considering the variables and their relationships that generated the data. DAGs are a straightforward tool for moving in that direction.
McElreath, R. (2020). Statistical Rethinking: A Bayesian Course with Examples in R and Stan (2nd edition). Chapman and Hall/CRC.
Pearl, J., Glymour, M., & Jewell, N. P. (2016). Causal Inference in Statistics: A Primer (1st edition). Wiley.
Rauch, J. (2021). The Constitution of Knowledge: A Defense of Truth. Brookings Institution Press.
This website reflects the author's personal exploration of ideas and methods. The views expressed are solely their own and may not represent the policies or practices of any affiliated organizations, employers, or clients. Different perspectives, goals, or constraints within teams or organizations can lead to varying appropriate methods. The information provided is for general informational purposes only and should not be construed as legal, actuarial, or professional advice.


